Radioactivity (with or without the resources)
 Elon Musk: “Odds are we’re
living in a simulation”
Elon Musk: “Odds are we’re
living in a simulation”
The terms ‘radiation’ and ‘radioactivity’ are often interchangeable in the public mind. Because of its invisibility, radiation is commonly feared.
True or false
1.Radioactive substances make everything near to them radioactive.
2.Once something has become radioactive, there is nothing you can do about it.
3.Some radioactive substances are more dangerous than others.
4.Radioactive means giving off radio-waves.
5.Saying that a radioactive substance has a half life of three days means any produced now will all be gone in six days
Story: Chernobyl
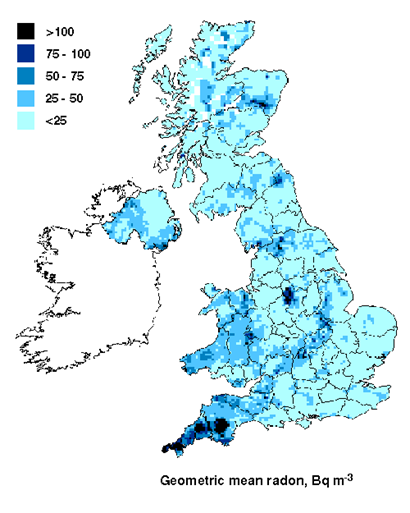
In April 1986, a serious accident occurred at the nuclear power station at Chernobyl in Russia. A week later, radiation detectors (Geiger counters) in Britain recorded higher than usual levels of radiation. Britain is more than 1000 miles from Chernobyl!
Explain what reached the Geiger counters in Britain to make them record extra counts.
Misconception Alert:
•Many students confuse ‘radiation’ and ‘radioactive material’.
•After the Chernobyl accident, many newspaper articles referred to a “cloud of radiation” and drinking water contaminated with “radiation”.
Misconception Alert:
Many students appear to interpret the idea that “radiation is absorbed” differently from the scientific interpretation. They believe that objects that have been irradiated will themselves become radioactive — that they can re-emit the radiation some time later.
The underlying idea here is that they seem to think that radiation is somehow “conserved”.
Beware:
•An inability to distinguish between the ideas of irradiation and contamination
•An inability to interpret the ideas of activity and dose
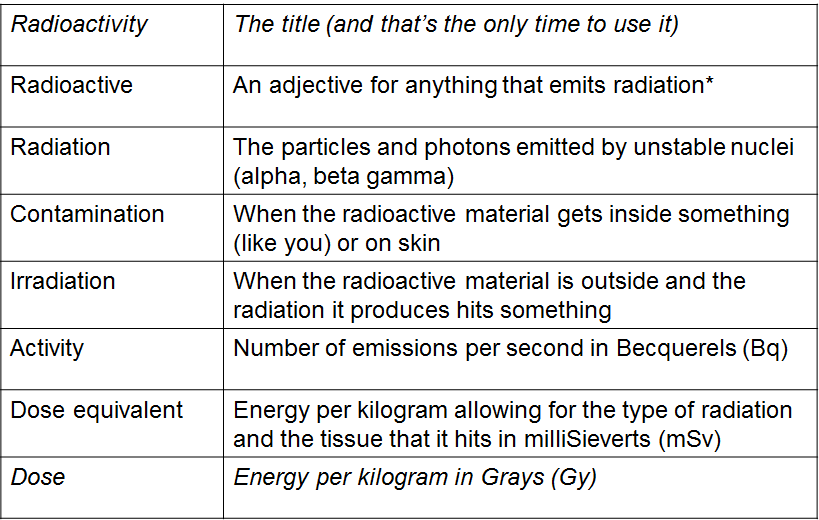
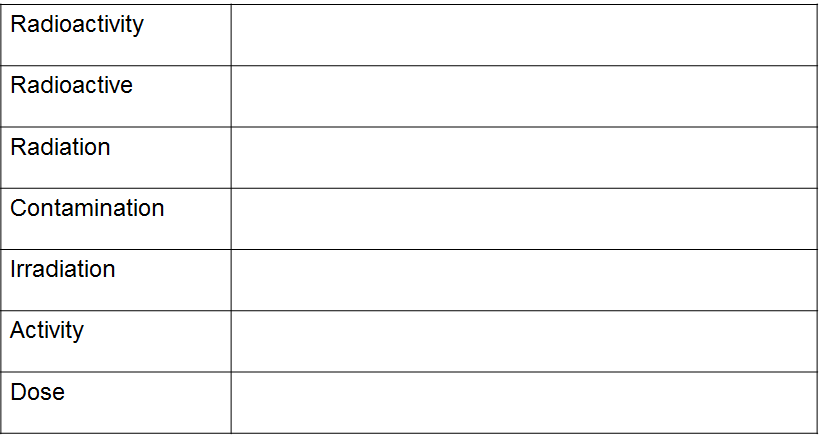 A white paper with black lines Description automatically generated
What is “radioactive”
The Radiation Protection Division of the Health Protection Agency defines a radioactive substance as having a specific activity ³ 400 Bq/kg.
Some Stories:
•1841- Eugene Peligot discovers uranium
•1895 — William Roentgen discovers X-rays
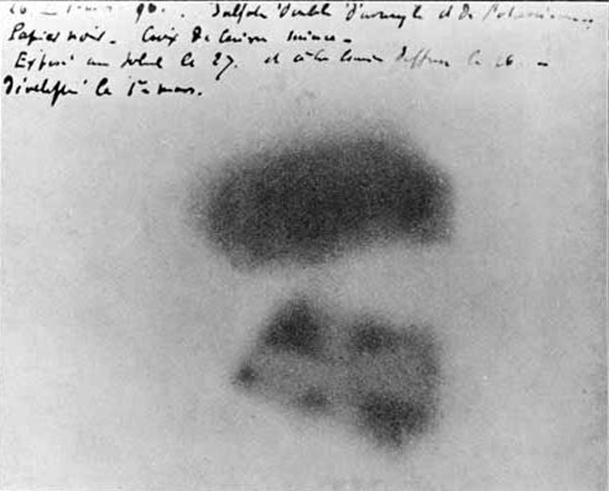
•1896 — Henri Becquerel discovers that rocks that contain uranium emit radiation
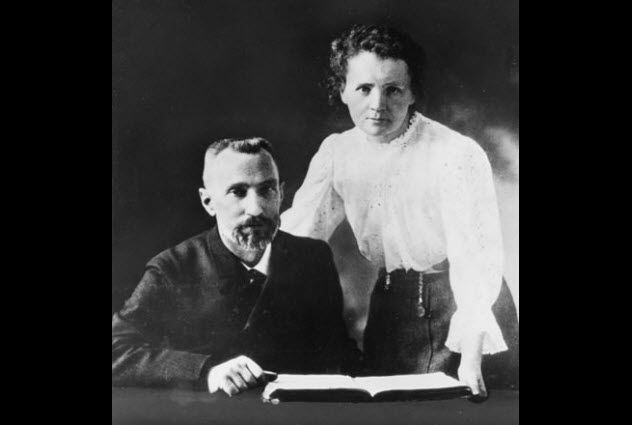
•1988/9 — Marie Curie discovers radium, polonium and thorium
•1903 — Becquerel, and the Curies get Nobel Prize
 The notebook that needs to be
stored in a lead box
The notebook that needs to be
stored in a lead box
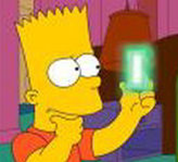
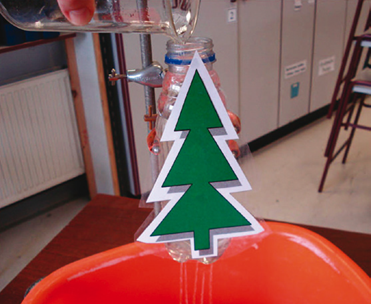
Story: Why green?
The ‘miracle cure’
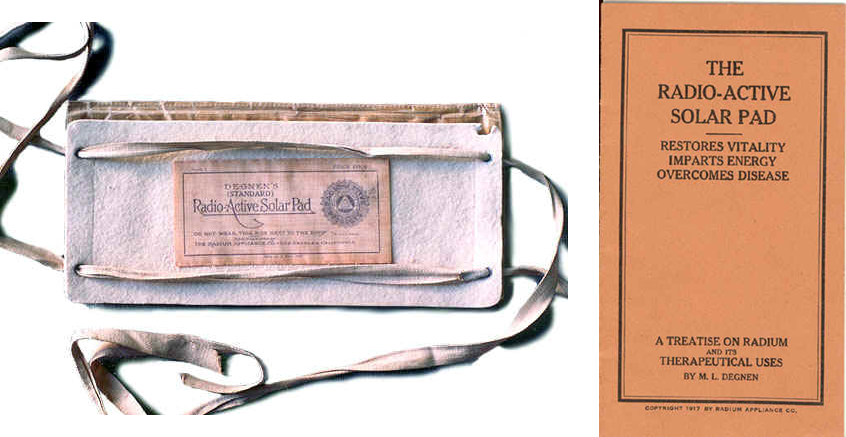
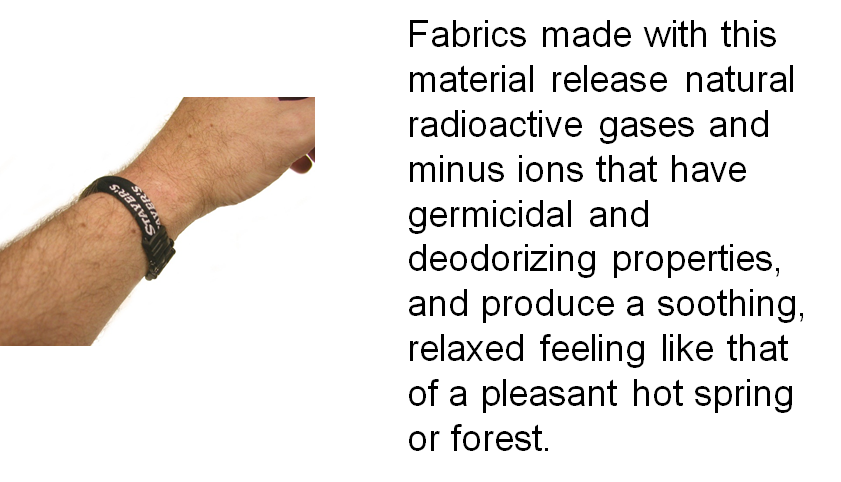
10/10 on the Canard scale!
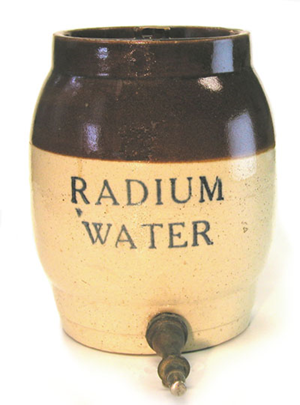
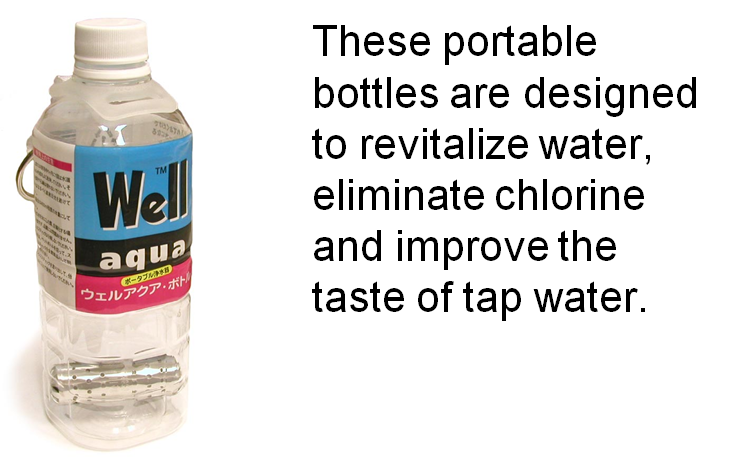
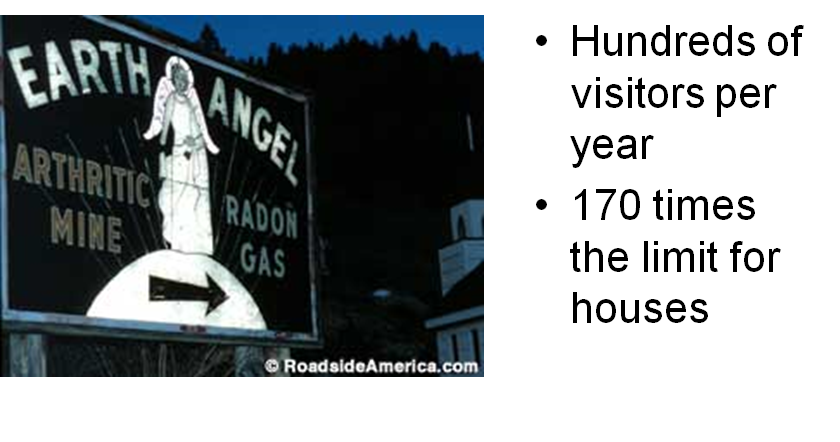
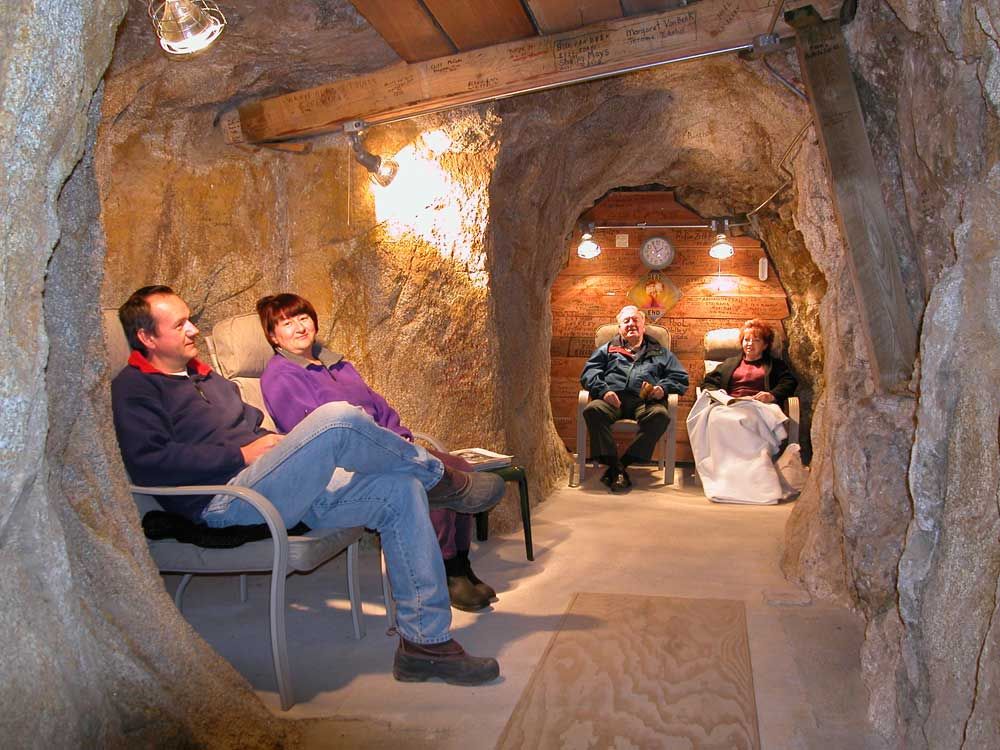 Image result for radon mine
health cure
Image result for radon mine
health cure
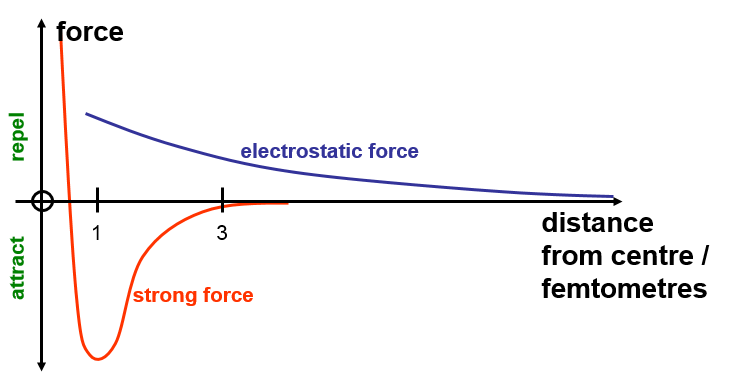
GCSE stuff:
The Strong Force.
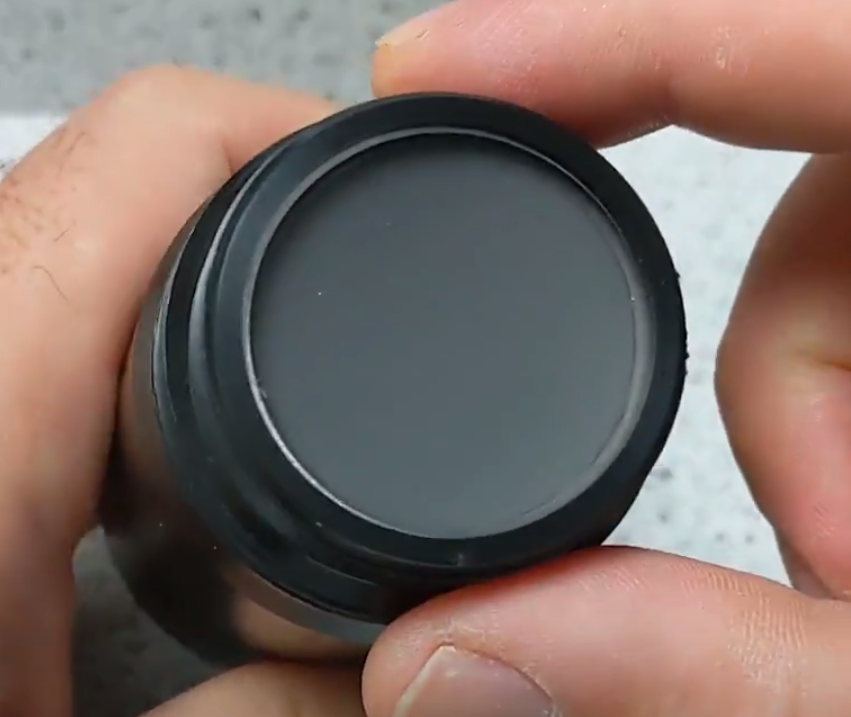
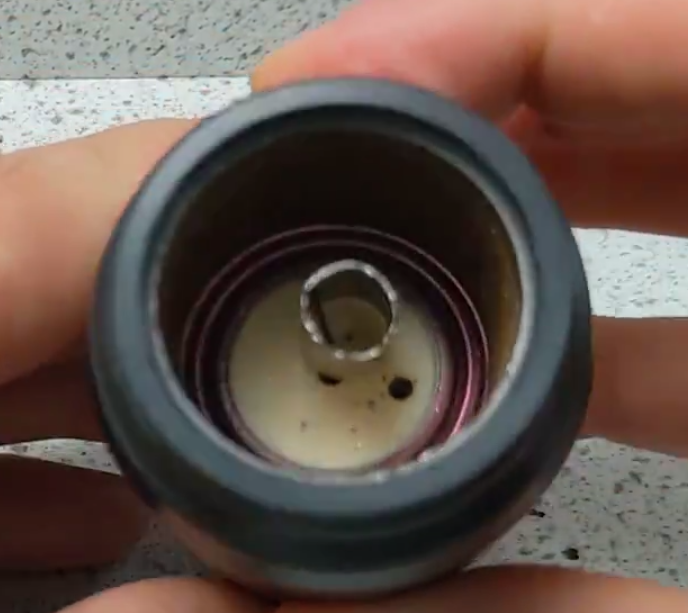
Detecting:
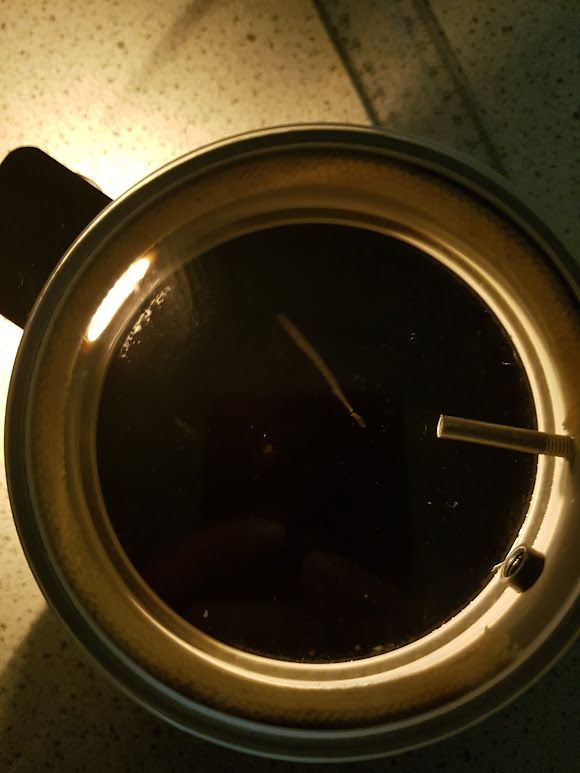
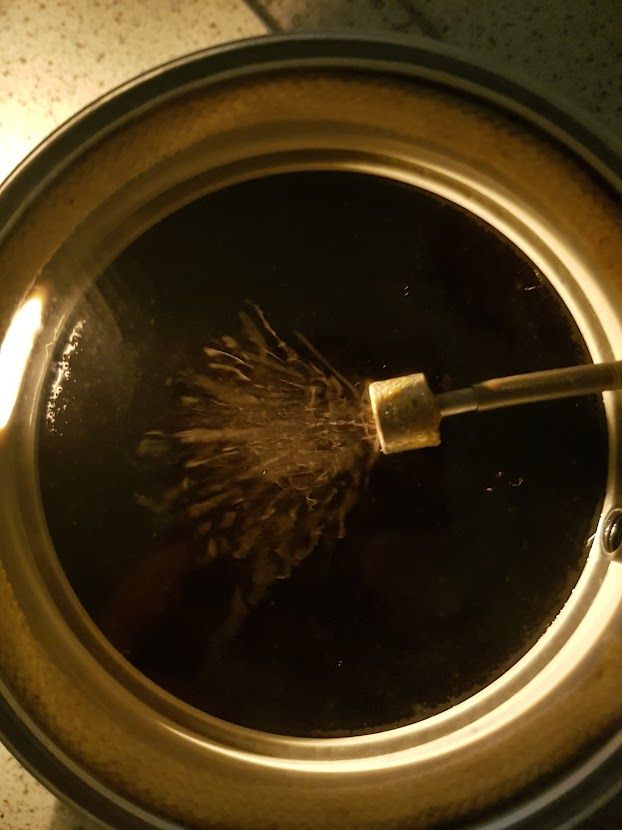
 File:Spark counter.webm - Wikimedia
Commons
File:Spark counter.webm - Wikimedia
Commons
https://www.dropbox.com/s/u8wp68sjmd8kbxd/PXL_20201114_094914017.mp4?dl=0
http://www.gigaphysics.com/gmtube_lab.html
https://www.anythingradioactive.com/index.php?route=product/product&product_id=185
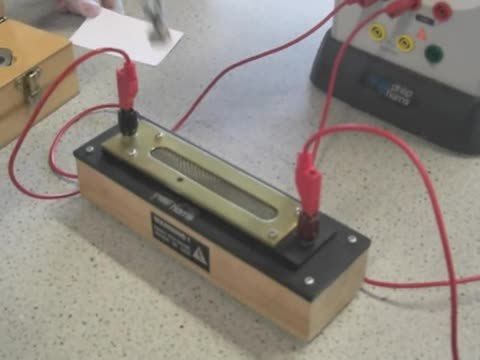
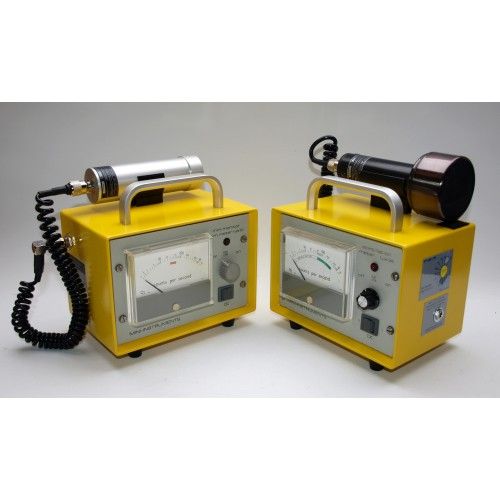 Mini Instruments Type 5.10
and 5.40 Geiger Counters
Mini Instruments Type 5.10
and 5.40 Geiger Counters
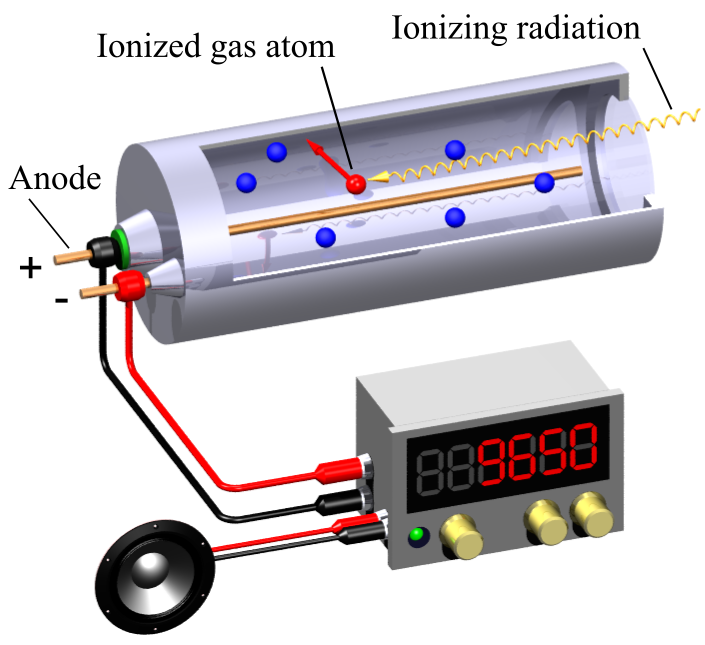
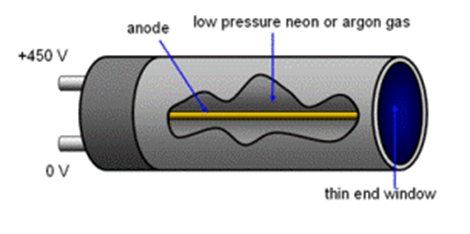
Ionisation Chambers
Alpha!
https://www.thingiverse.com/thing:1247966
https://phet.colorado.edu/en/simulation/legacy/alpha-decay
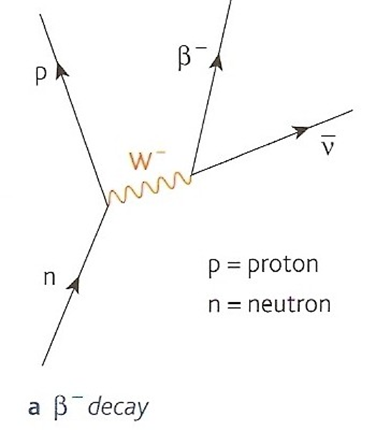
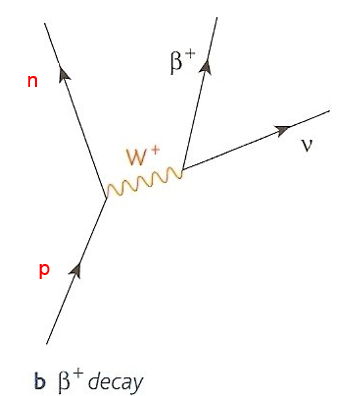
Beta Decay
https://phet.colorado.edu/en/simulation/legacy/beta-decay
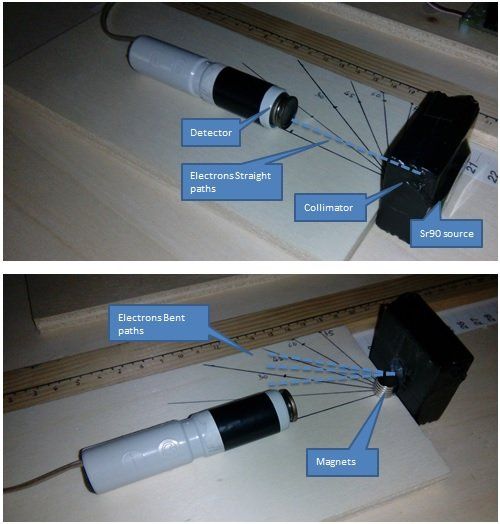
Magnetic steering
https://spark.iop.org/beta-radiation-deflection-magnetic-field#gref
 Related image
Neutrinos!
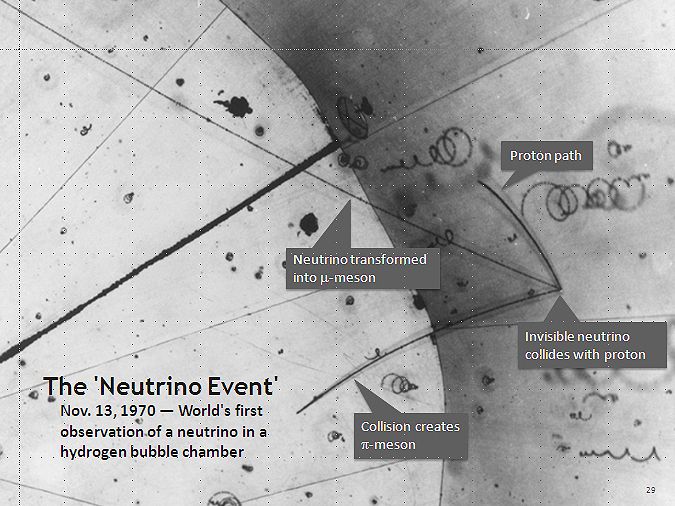 Neutrino - Wikipedia
King’s physicists herald Big Bang breakthrough in particle physics
Antimatter
All particles of normal matter, such as protons, neutrons and electrons have a corresponding particle that:
1.has the same mass as the normal particle
2.has opposite charge (if the normal particle is charged)
3.will undergo annihilation with the normal particle if they meet
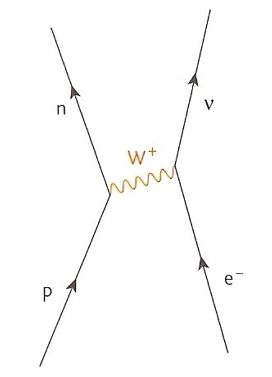
Electron Capture
Without resources:
https://radiation-lab.software.informer.com/
http://nuclearconnect.org/in-the-classroom/for-teachers/classroom-resources
http://www.nuffieldfoundation.org/science-society/activities-radiation-risks-and-uses
Radioactivity all around!
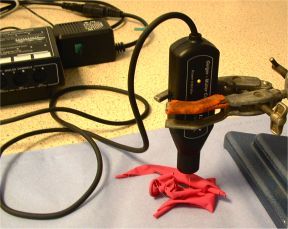 balloon
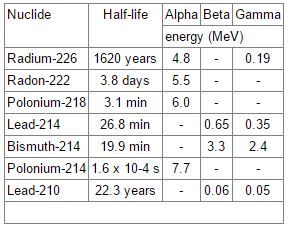 decay table
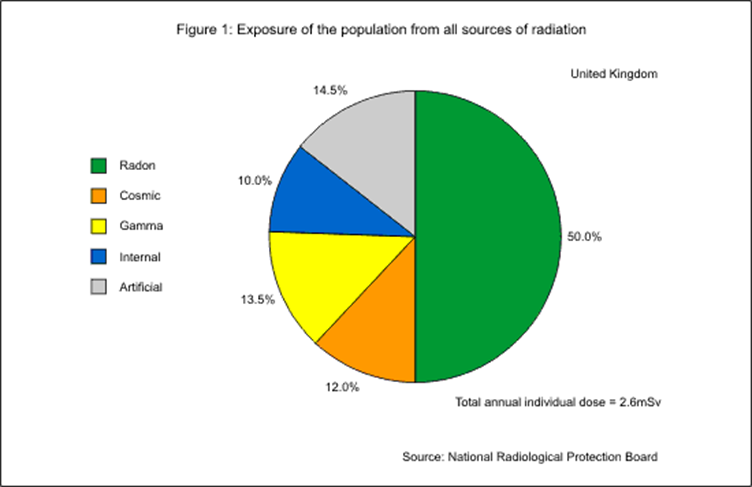
People are radioactive - Typically 7000 Bq. So “it’s dangerous to sleep with somebody”! However, most of the resulting radiation is absorbed within the ‘owners’ body.
https://www.youtube.com/watch?v=Pt-SMAVN898
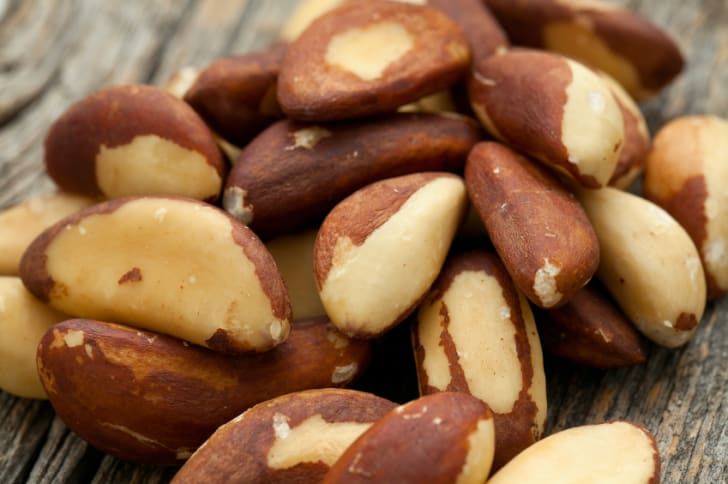
Brazil nuts (especially the ones grown in Brazil) grow on trees with deep and very extensive roots, the soil where a lot of the trees grow in brazil is high in radium, which then makes its way to the nuts. As a result, the radium levels of Brazil nuts can be 1000 times what you’d see in other foods. Brazil nuts not grown in Brazil are often not radioactive!

Sort-of sources:
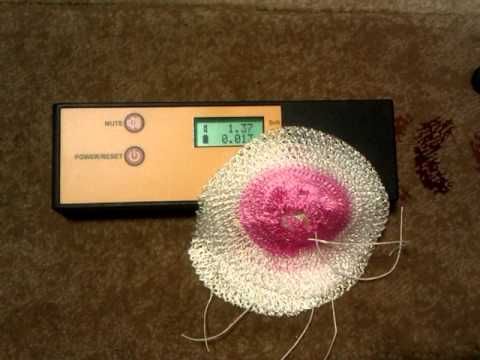
Gas Mantles
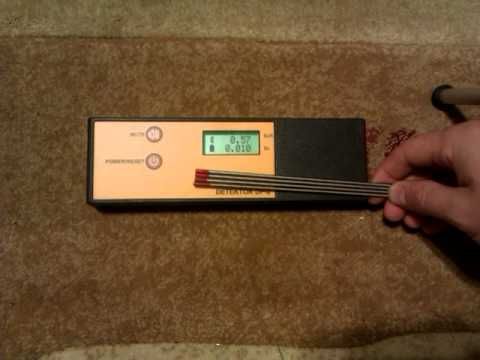
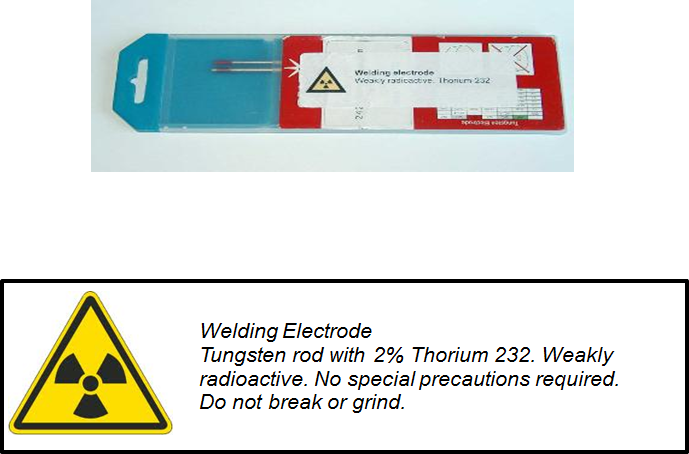
Thoriated welding rod
Uranium Glass
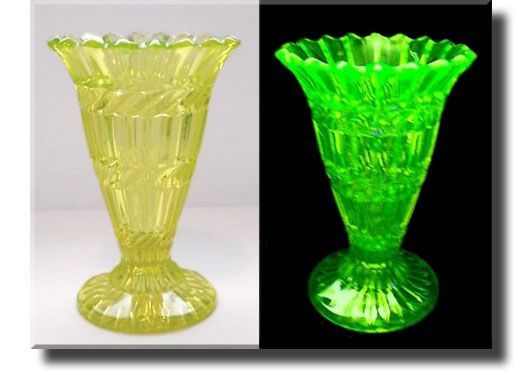 Image result for uranium
glass
Image result for uranium
glass
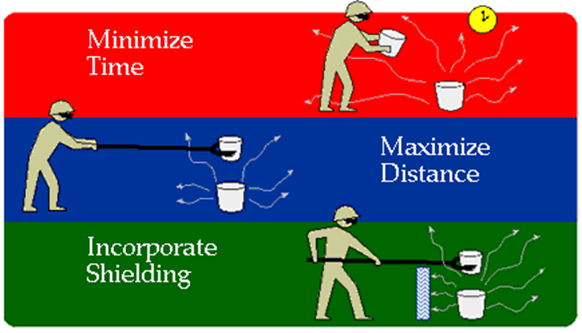
Safety
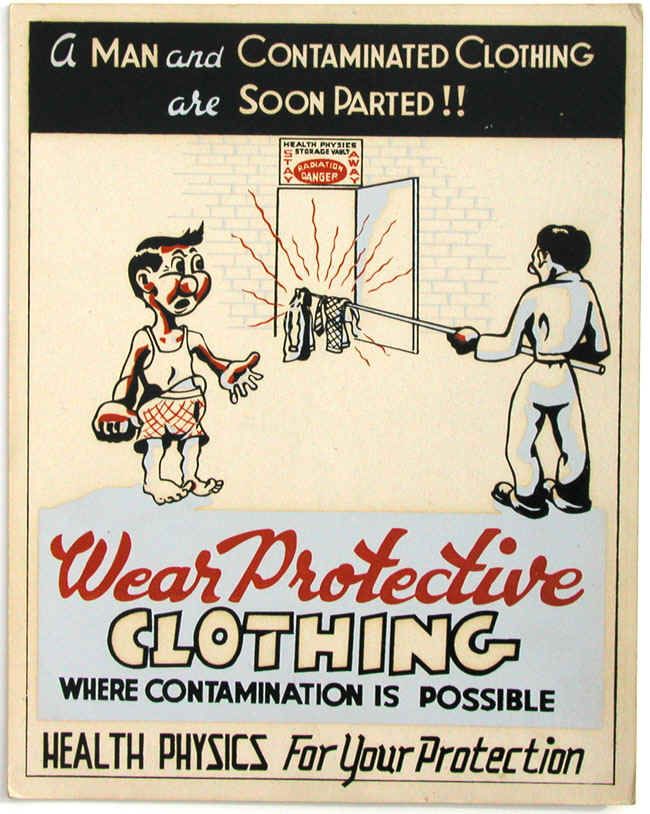 Health Physics Posters |
Museum of Radiation and Radioactivity
Health Physics Posters |
Museum of Radiation and Radioactivity
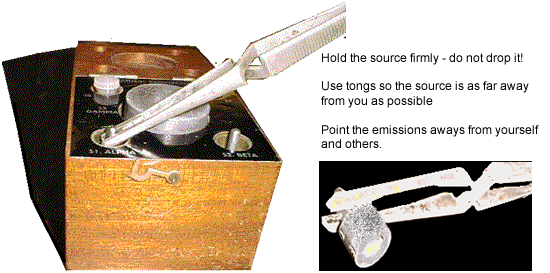
The sources
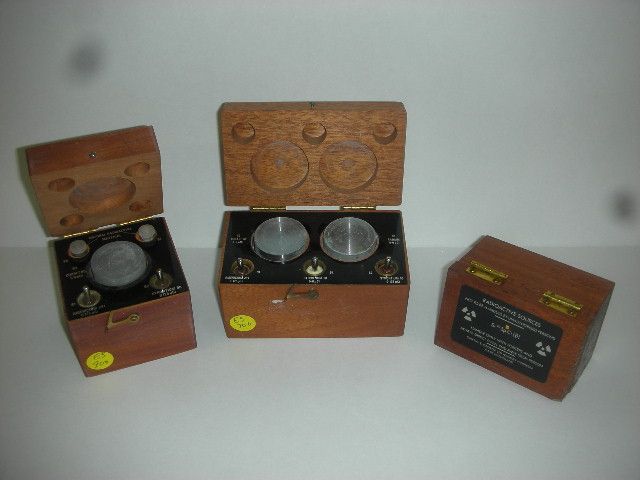 Image result for school
radioactive sources
Image result for school
radioactive sources
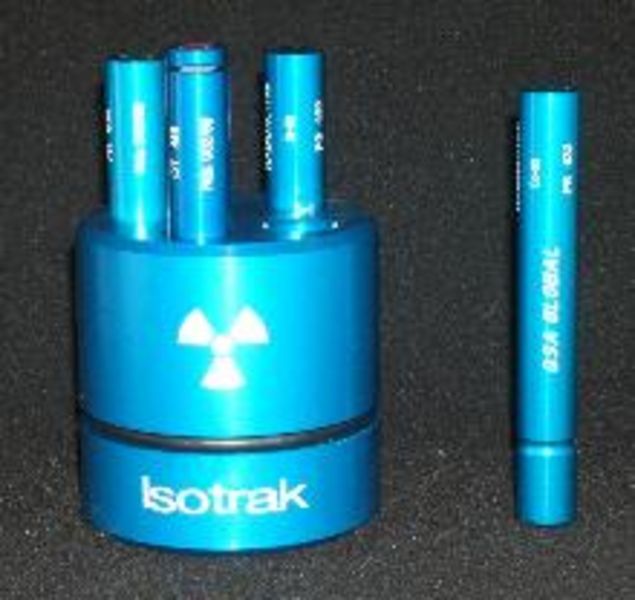 School radioactive
sources
School radioactive
sources
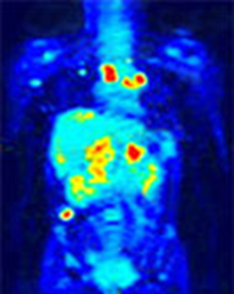
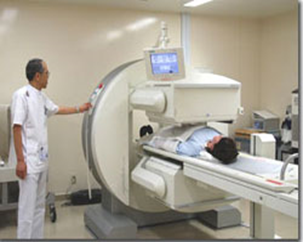
Uses of radioactivity
Medicine
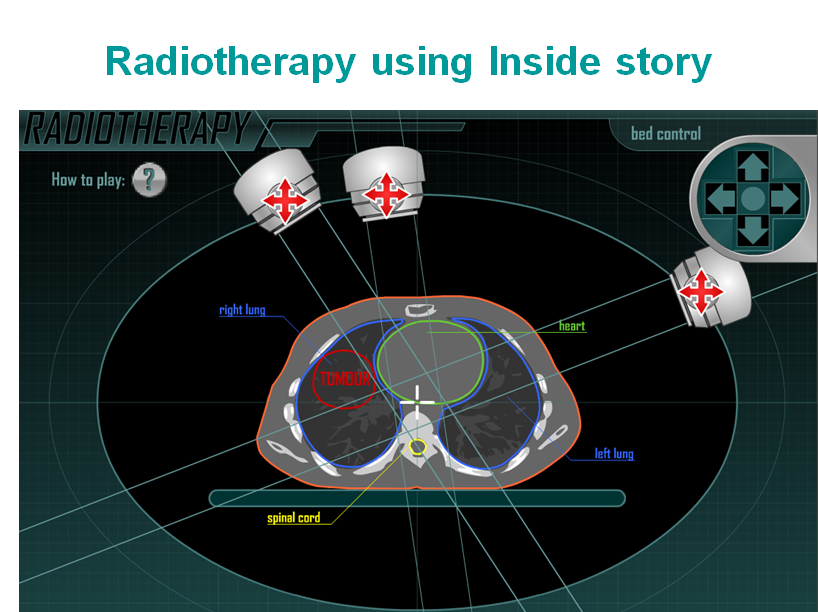
https://spark.iop.org/radiotherapy-planning-interactive
http://insidestory.iop.org/insidestory_html.html
gamma knife
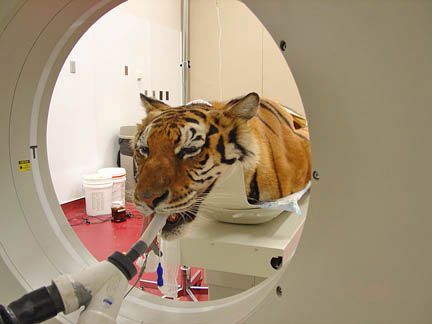 tiger in cat scan
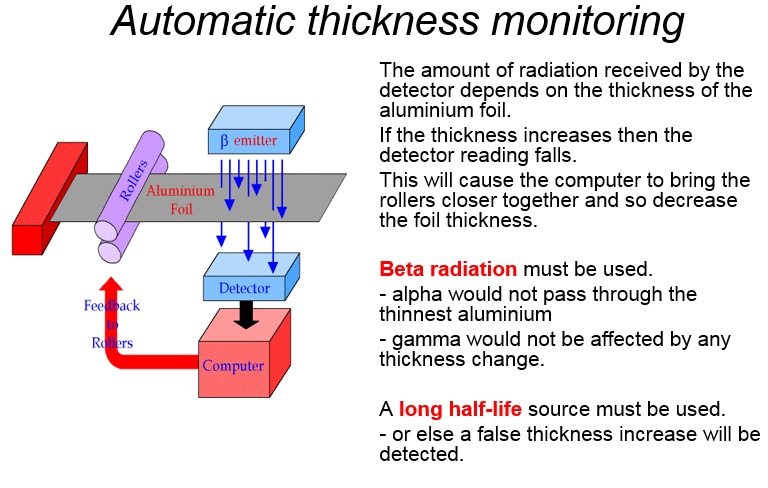
Paper
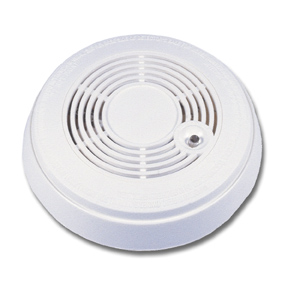
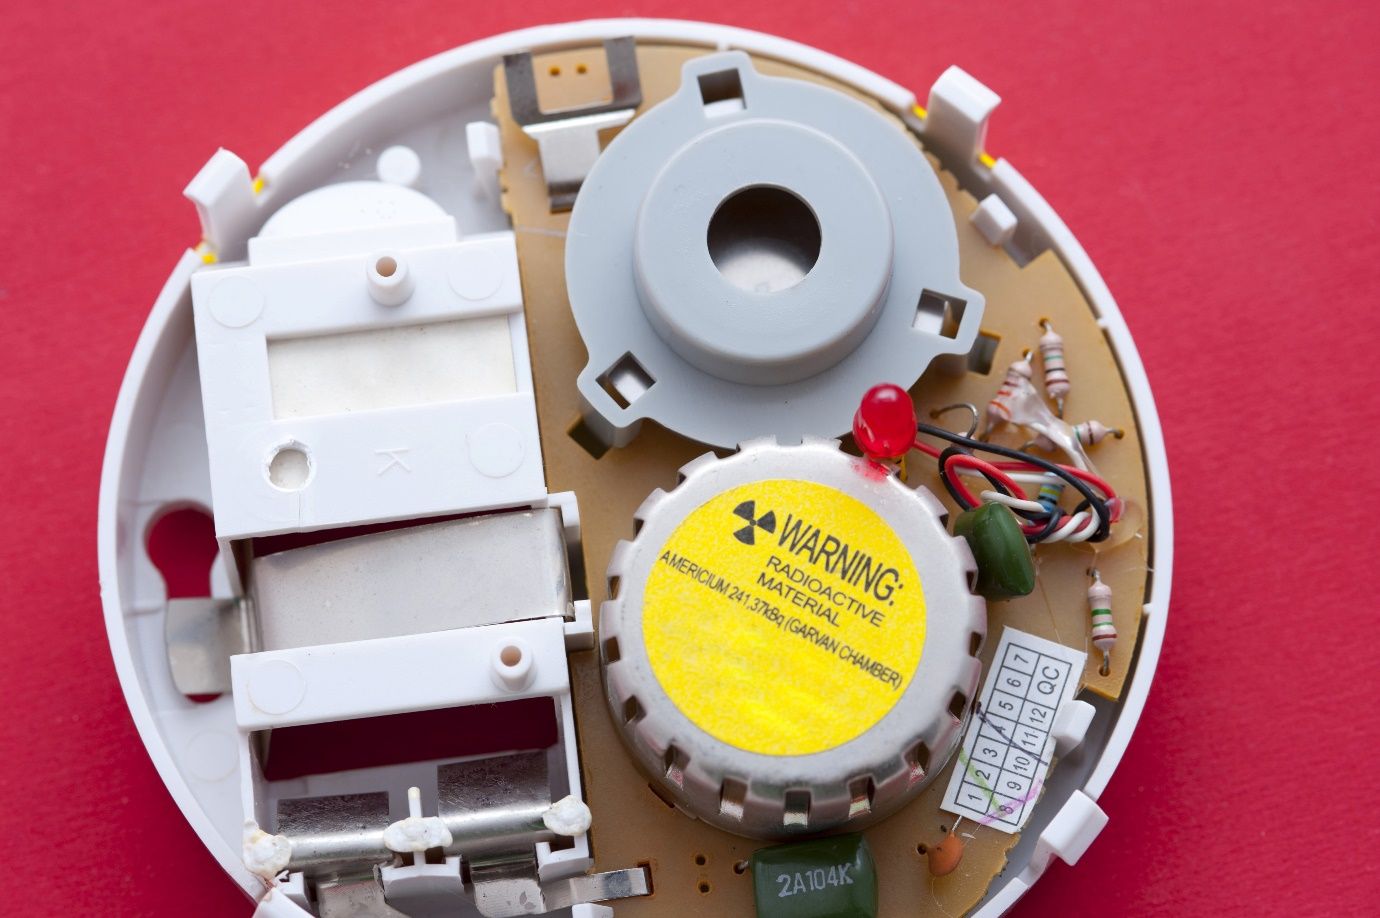
Smoke detector
Bombs
Power stations
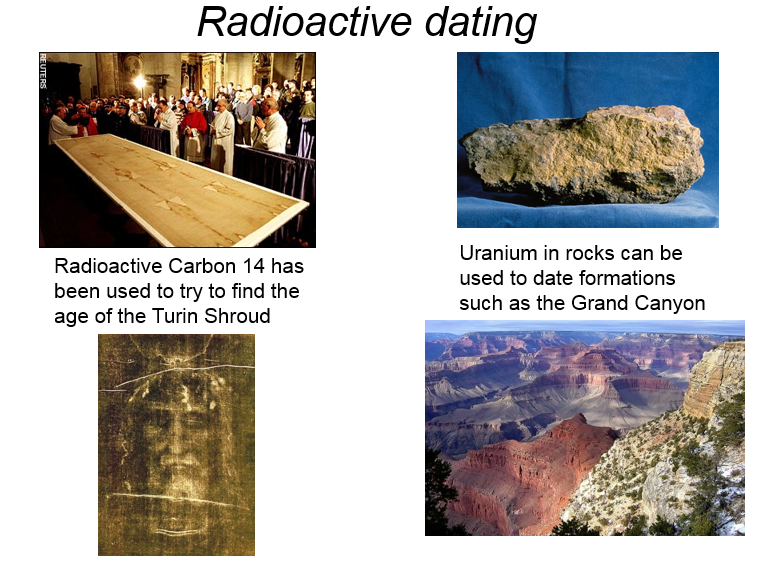
 graph of c14decay
https://www.dropbox.com/s/9d0uixwa4s3v6h5/PXL_20201114_143810352.mp4?dl=0
Stability and decay:
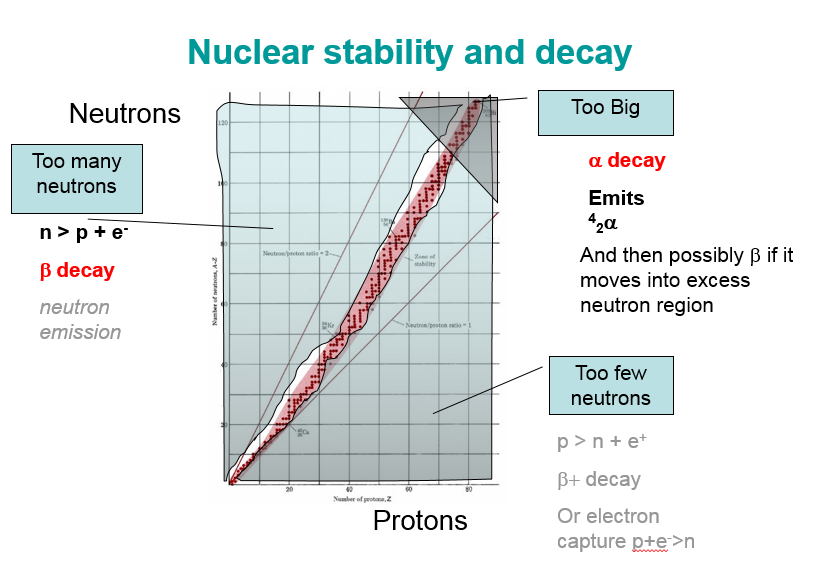
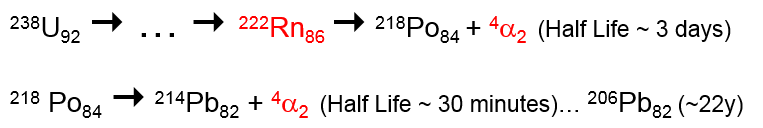
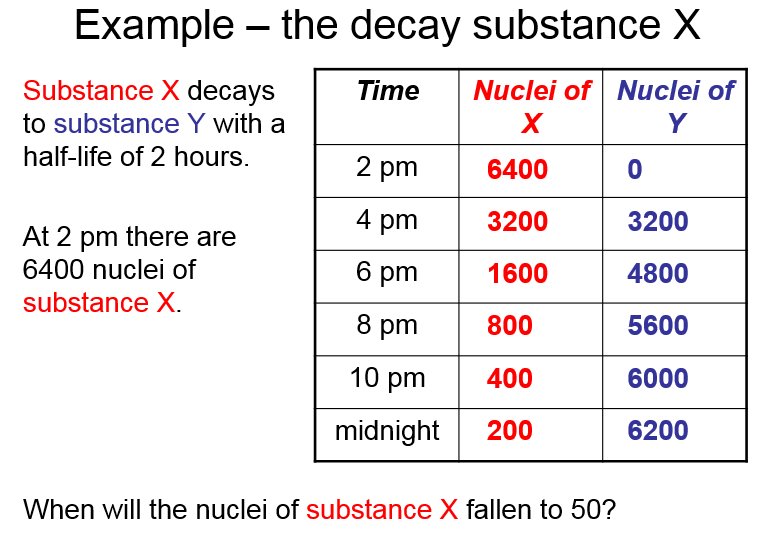
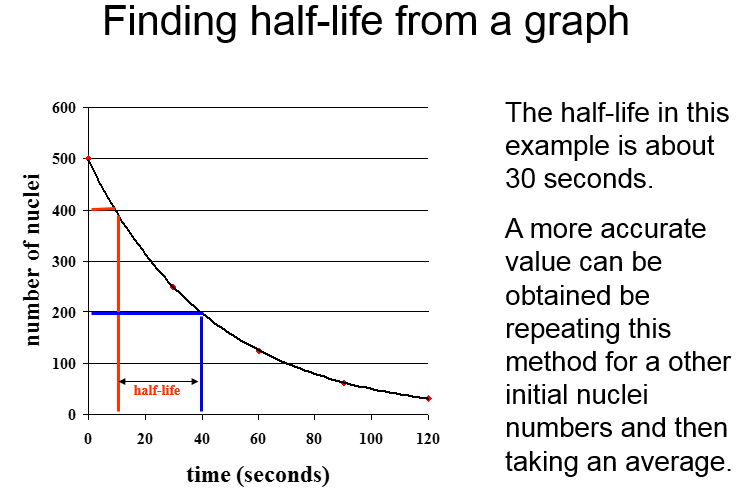
Decay and half life
The half-life of a radioactive isotope is:
The time it takes for the number of nuclei of the isotope in a sample to halve.
OR
The time it takes for the count rate from a sample containing the isotope to fall to half its initial level.
Beware of simulations!
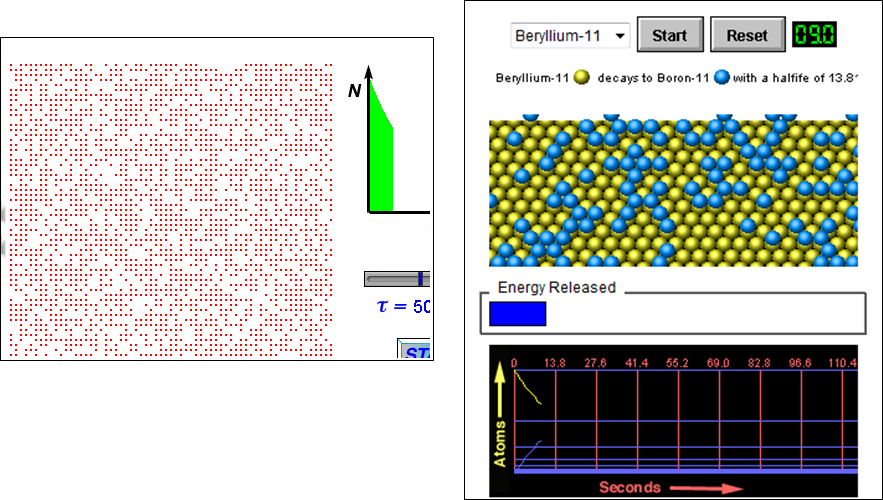
 Pearson - The Biology
Place
Pearson - The Biology
Place
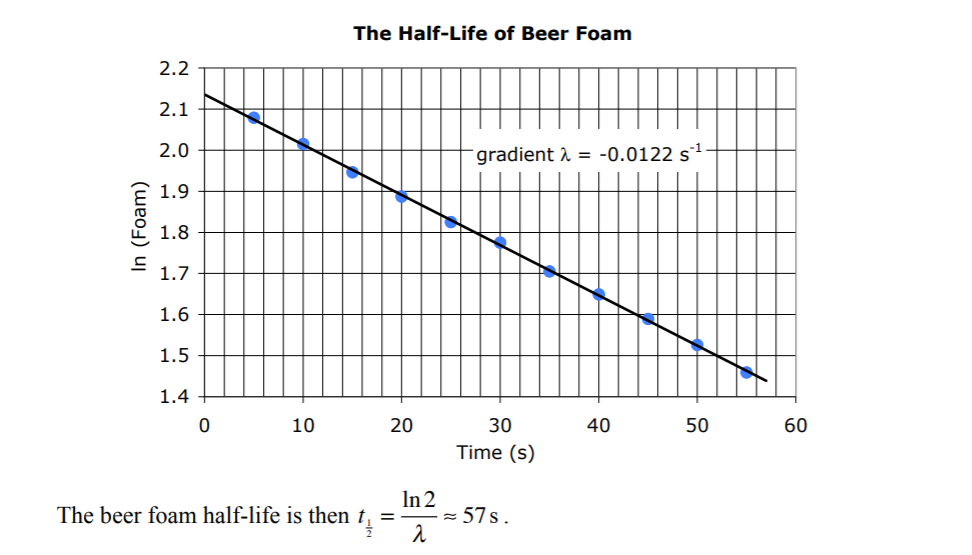
Beer, cake, water from a bottle.
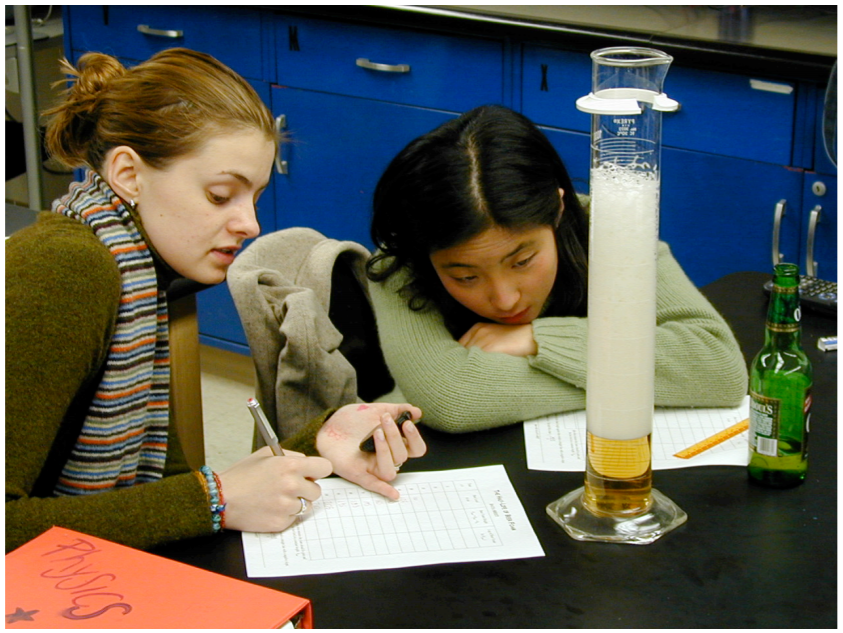 https://www.slps.org/cms/lib03/MO01001157/Centricity/Domain/2501/Half_life_of_Beer_Foam_lab.pdf
Protactinium
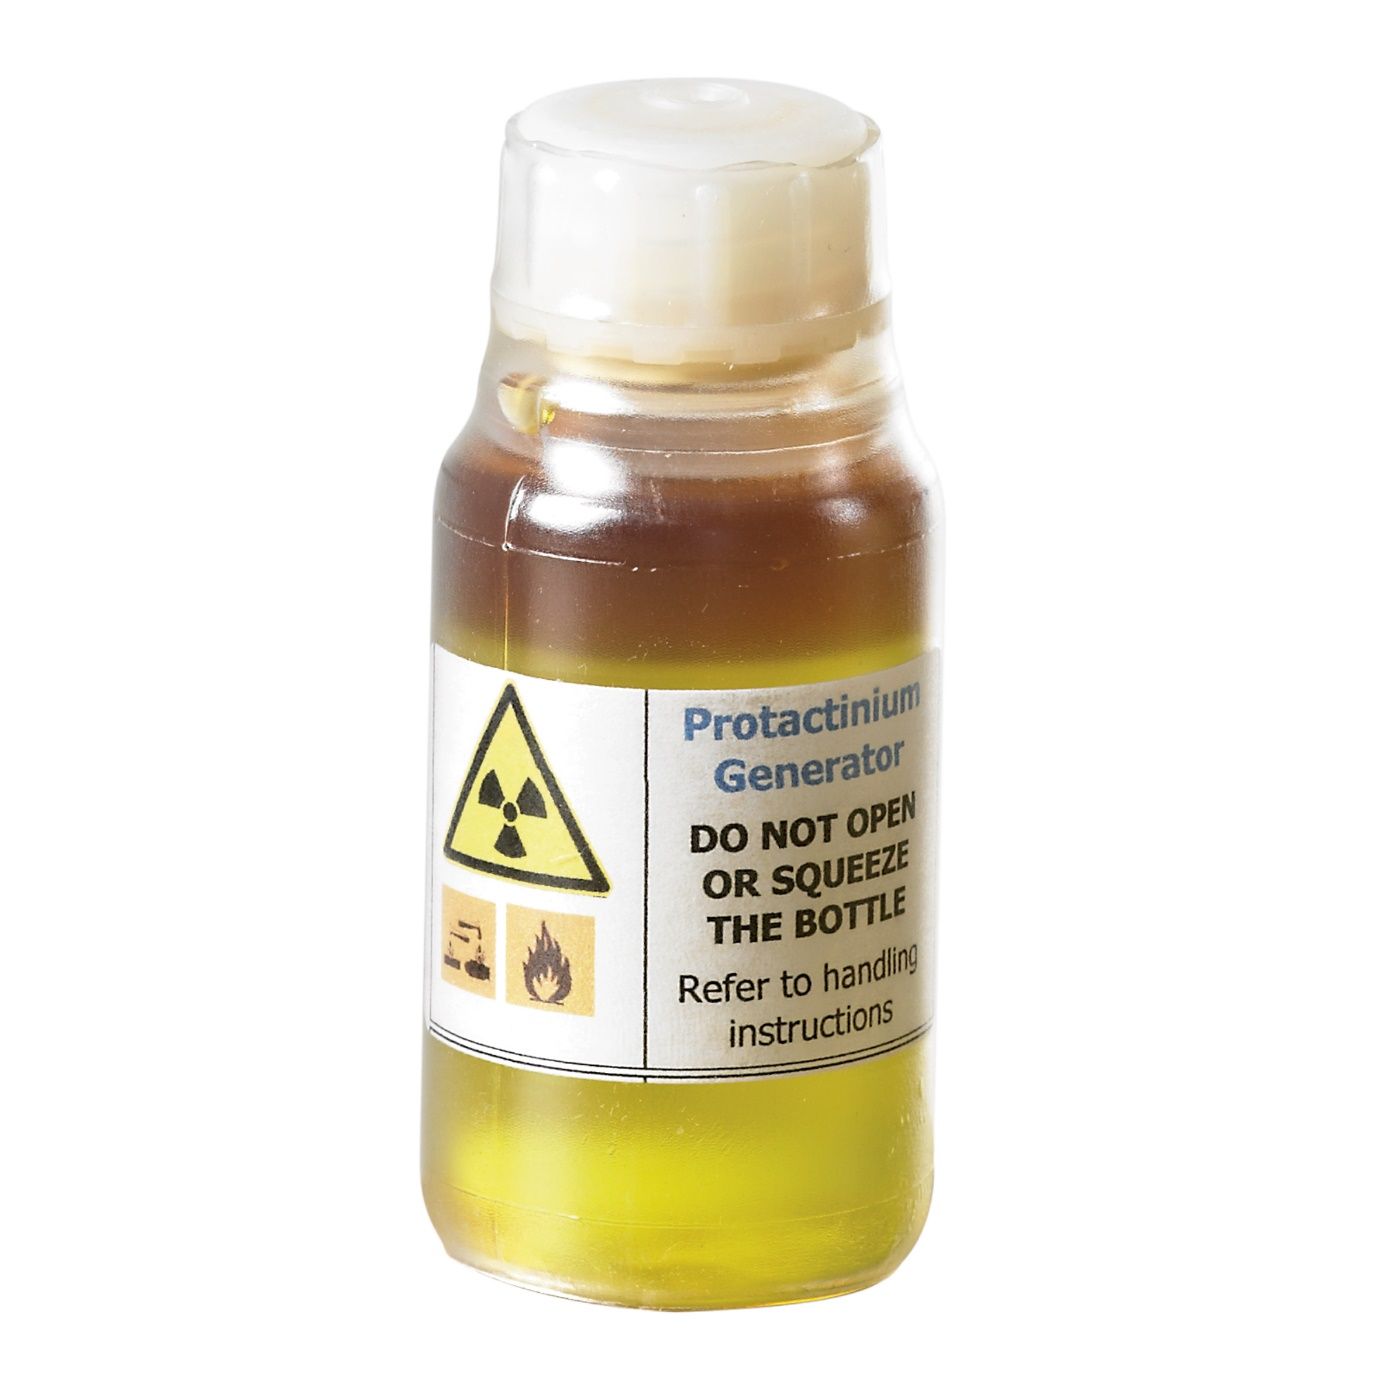 https://spark.iop.org/search?query=protactinium
Examples:
Uranium 238 = 4500 million years
Uranium 235 = 704 million years
Plutonium 239 = 24 100 years
Carbon 14 = 5600 years
Strontium 90 = 29 years
Hydrogen 3 (Tritium) = 12 years
Cobalt 60 = 5.2 years
Technetium 99m = 6 hours
Radon 224 = 60 seconds
Helium 5 = 1 x 10-20 seconds
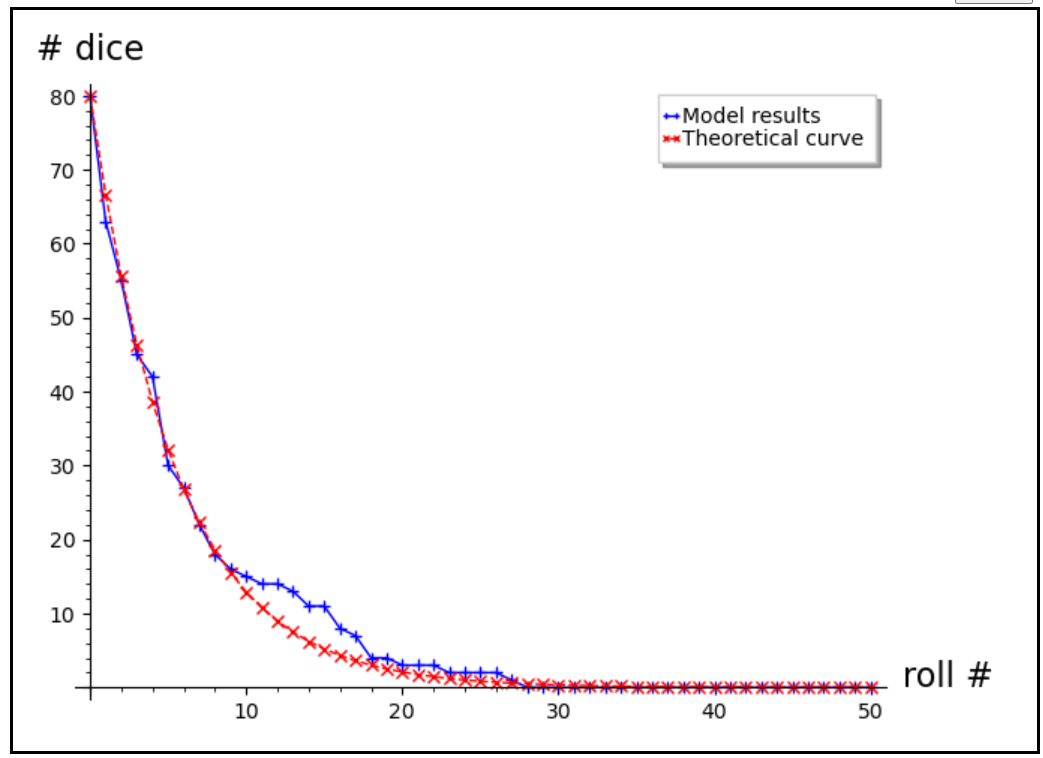
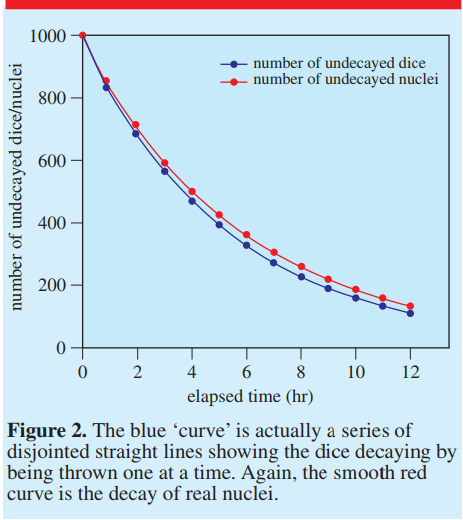
Dice rolling -
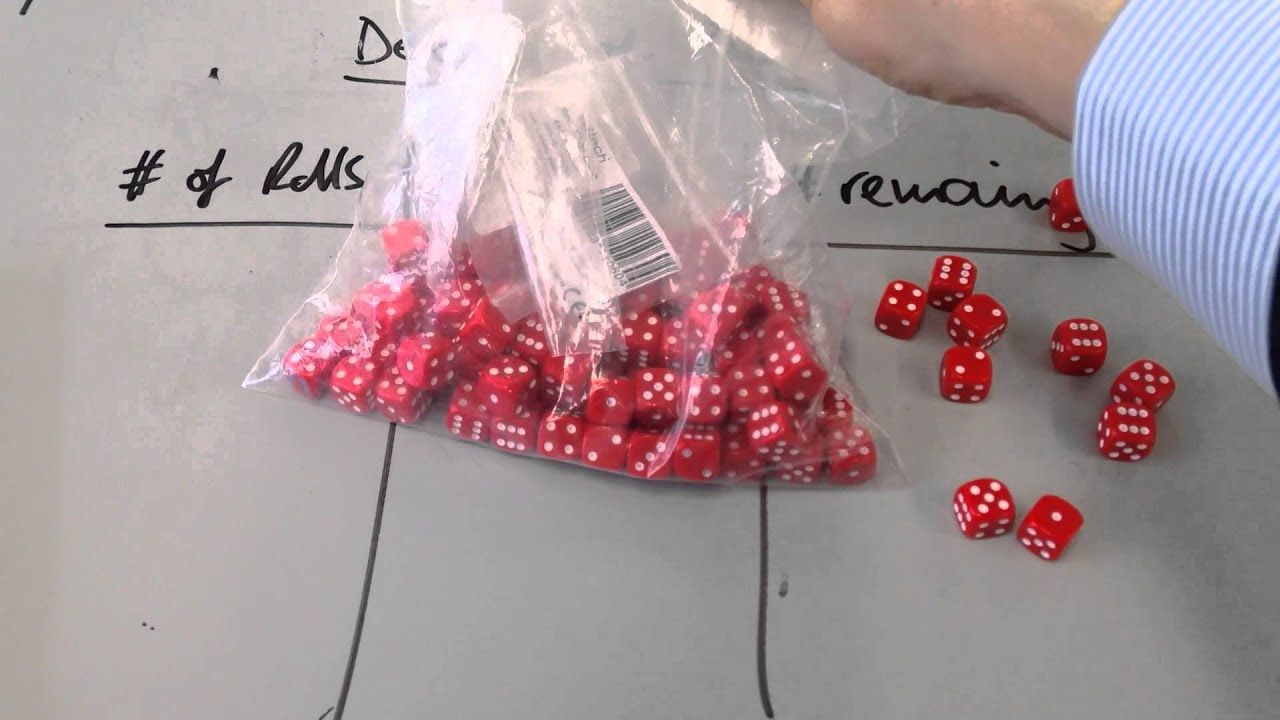
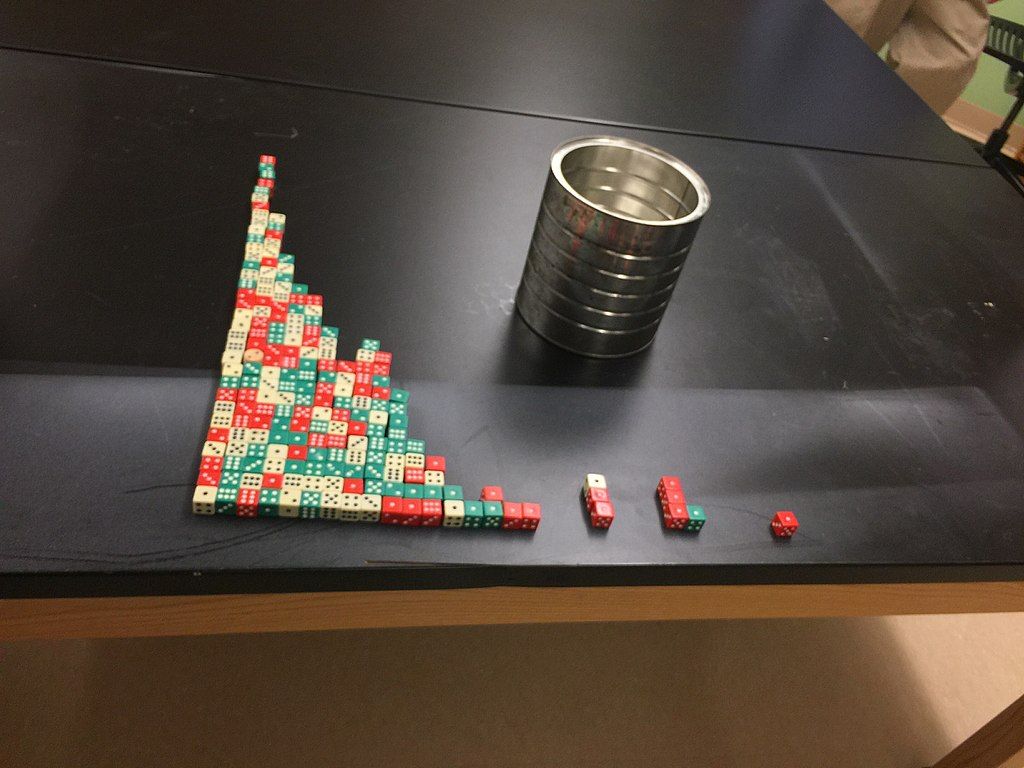
Why the dice rolling model is wrong: (http://iopscience.iop.org/0031-9120/47/2/197)
https://jrowing.com/radioactive-decay-modelling
# some library objects we need
from numpy.random import binomial, seed
from numpy import zeros, arange
from matplotlib import pyplot as plt
# initial population
P0 = 80
# number of rolls per experiment
n_rolls = 50
# number of experiments
n_exp = 1
# probability that any given die will “decay” on a given roll
p = 1/6
# location to track average dice remaining for each roll number
pop_avg = zeros(n_rolls+1)
# “seed” the random number generator
# (This makes the results look different
# each time the code is run.)
seed()
# loop over experiments
for n in range(n_exp):
# reset the dice population
P = P0
# roll the dice
for k in range(1,n_rolls+1):
# figure out how many dice decay this time
r = binomial(P,p)
# remove the dice
P -= r
# update the average
pop_avg[k] += P
# final division to compute the averages
pop_avg /= n_exp
# we always started with P0
pop_avg[0] = P0
# compute the model predictions
model = (1.0-p)**arange(n_rolls+1.0)*P0
pl1 = list_plot(pop_avg,plotjoined=True,marker=‘+’,legend_label=‘Model results’,axes_labels=[‘roll #‘, ‘# dice’])
pl2 = list_plot(model,plotjoined=True,linestyle=‘–’,color=‘red’,marker=‘x’,legend_label=‘Theoretical curve’)
show(pl1+pl2)
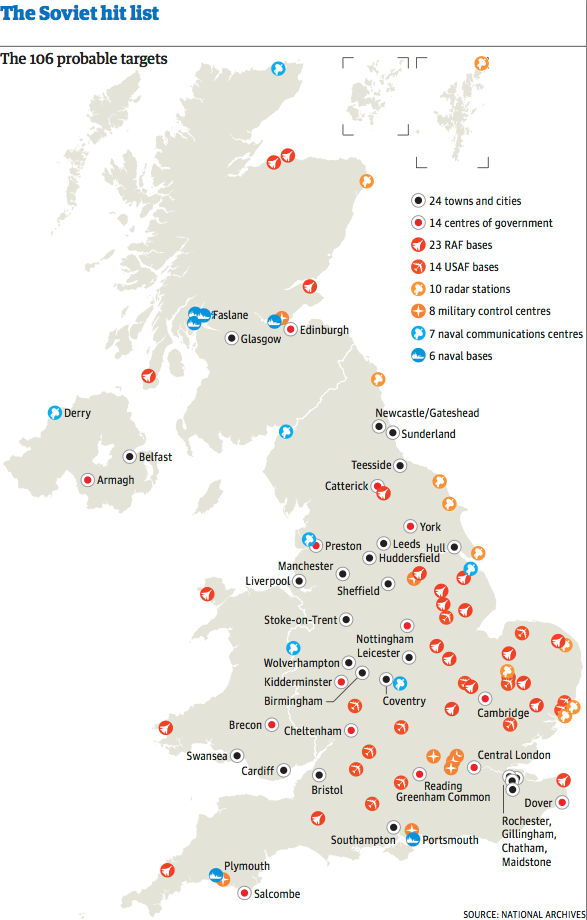
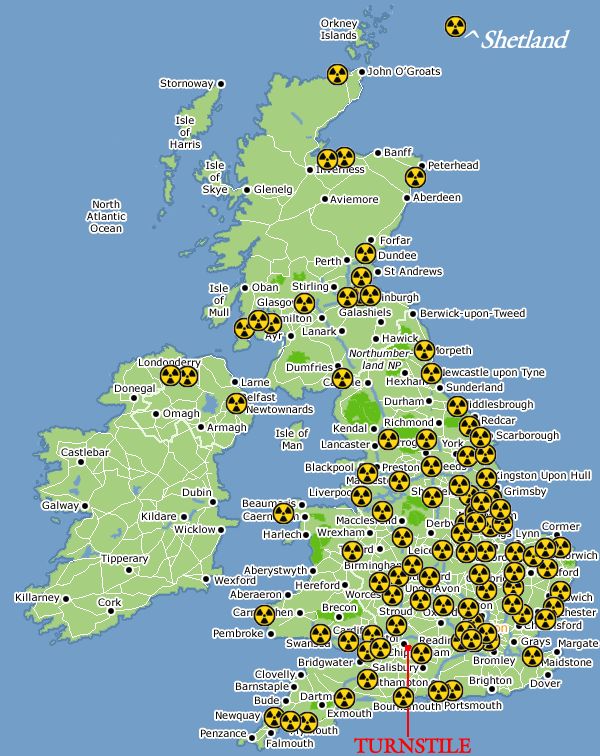
Warfare
https://nuclearsecrecy.com/nukemap/
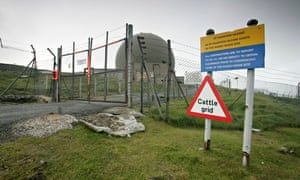 Saxa Vord radar base on Unst in
Shetland was believed to be a probable nuclear target in the 1970s
Saxa Vord radar base on Unst in
Shetland was believed to be a probable nuclear target in the 1970s
Nuclear Power
https://www.scientificamerican.com/article/coal-ash-is-more-radioactive-than-nuclear-waste/
Nuclear Fission vs Fusion - Nuclear Power
Fission
https://www.nuclearinst.com/Nuclear-Reactor-Simulator
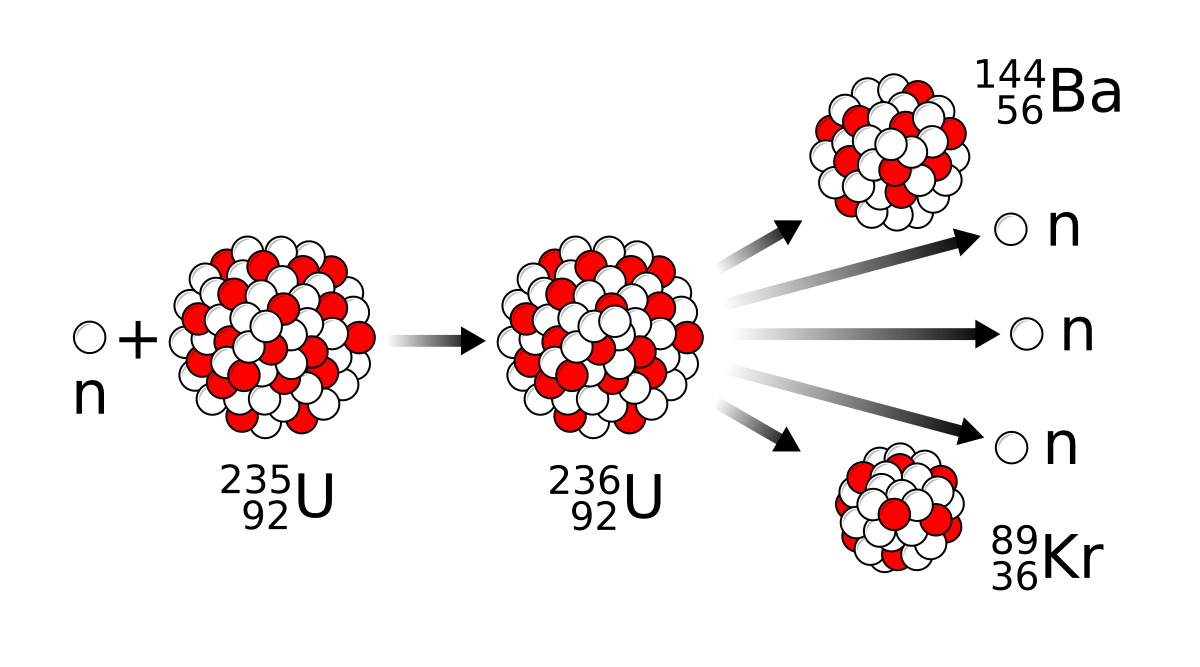 Discovery of nuclear fission
- Wikipedia
Discovery of nuclear fission
- Wikipedia
Fusion
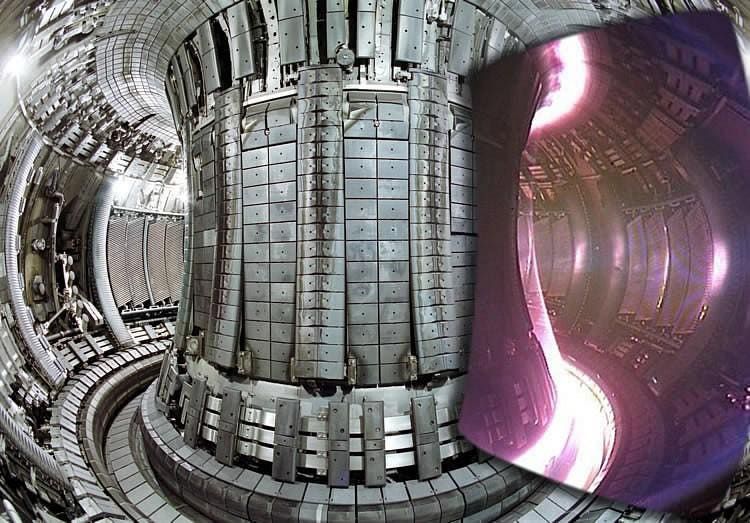 Is Fusion Power Within Our
Grasp?
Is Fusion Power Within Our
Grasp?
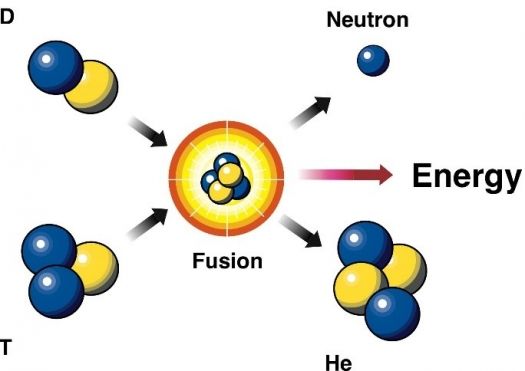 DOE Explains…Nuclear Fusion
Reactions | Department of Energy
DOE Explains…Nuclear Fusion
Reactions | Department of Energy
Fun things to do:
Stop motion with lego/plasticine
Mr Tompkins in paperback (literacy)
https://archive.org/search.php?query=creator%3A%22George+Gamow%22
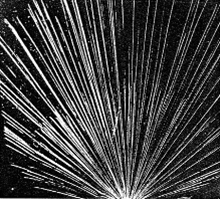
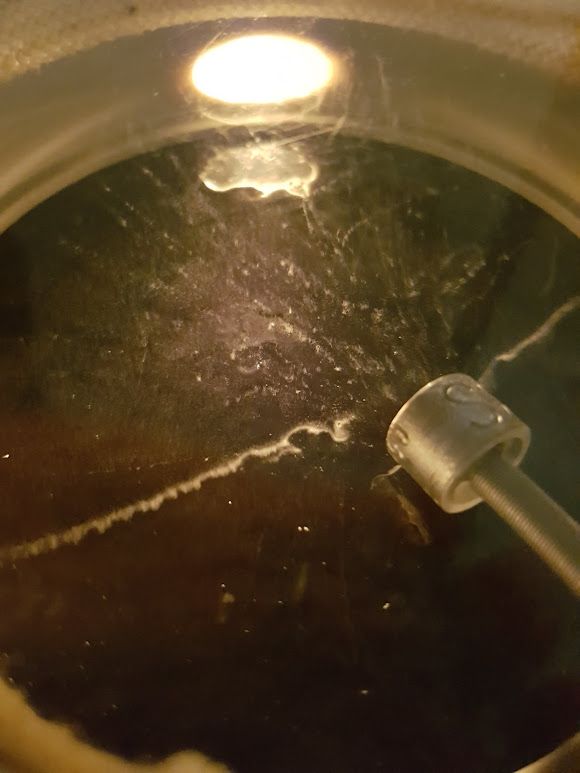
Cloud chambers
https://spark.iop.org/collections/cloud-chambers#gref
Chain reaction
Chain Reaction | Pepsi Max | #LiveForNow - YouTube
Stop motion
Rutherford experiment
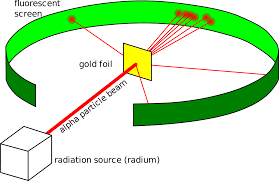
https://pubs.acs.org/doi/pdf/10.1021/ed084p626
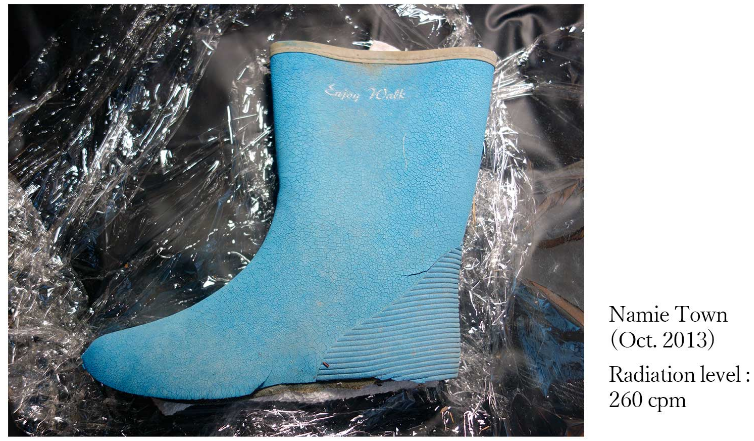
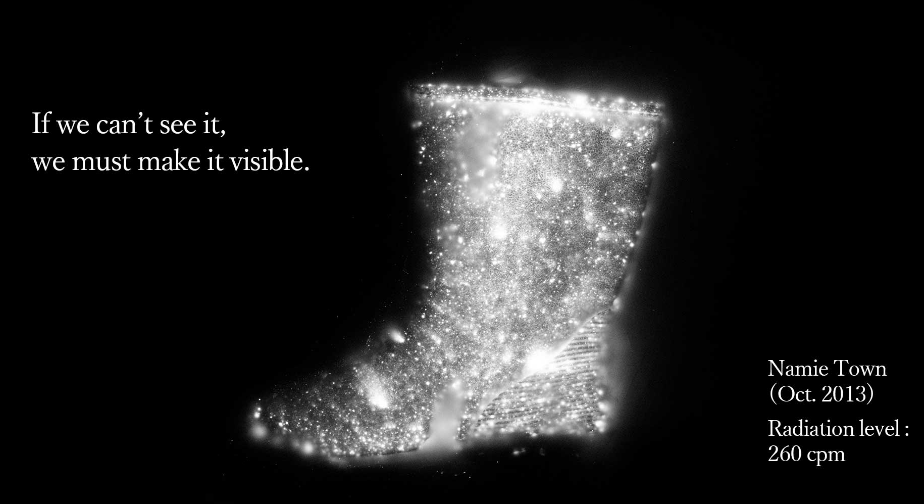
Autoradiographs

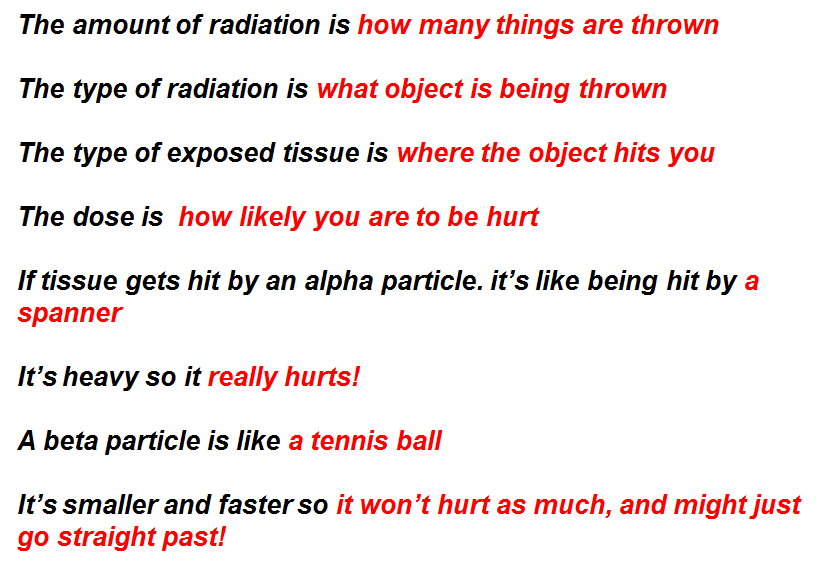
Dodgeball analogy

Teaching Order
Group 1. A phenomenological orientation.
Lesson 1. Source -> radiation -> detector model. Phenomena including light, infra-red and radioactivity can all be interpreted using this model.
Group 2. Qualitative macroscopic treatment.
Lesson 2. What happens when radiation is absorbed? Demonstrations using light show that the radiation can be absorbed and is no longer there. The absorber does not consequently become a light source.
Lesson 3. Three types of radiation. Experiments to show that there are three types of radiation from radioactive sources. These can be found in the Teachers TV programme.
Lesson 4. Radioactivity all around us. Introduces the idea that there are weak sources of radioactivity all around us - background radiation.
Lesson 5. Open and closed sources. The UYSEG scheme uses a simulation of the Chernobyl accident to distinguish between open and closed sources and the ideas of contamination and irradiation.
Lesson 6. Putting radioactive sources to use. For example as tracers and in medicine.
Group 3. A quantitative macroscopic treatment.
Lesson 7. Comparing sources. Activity and half life. The demonstrations and activities from the programme could be used here.
Lesson 8. Radiation dose. How much do we get? The background radiation worksheet could be used here.
Group 4. A treatment at the atomic level.
Lesson 9. Atoms, nuclei and transmutations. Only now are students introduced to an explanation at an atomic level. They consider the evidence for the explanations. The animations from the programme would be useful in this lesson.
Lesson 10. Randomness and chance. Simulations using dice and coins. The activities from the programme could be used here.